Hello, I'm

Priyanka B

Cloud & DevOps Enthusiast • AI • Data Science

Passionate Information Technology student building modern cloud applications, AI-powered solutions, and scalable software while continuously exploring new technologies.

View My Projects

About Me

I am a passionate Information Technology student with a strong interest in Cloud Computing, DevOps, Artificial Intelligence, Data Science, and Full-Stack Development. I enjoy building practical projects, learning emerging technologies, and solving real-world problems through software. My goal is to continuously grow as an engineer while creating impactful, scalable, and user-focused solutions.

Projects

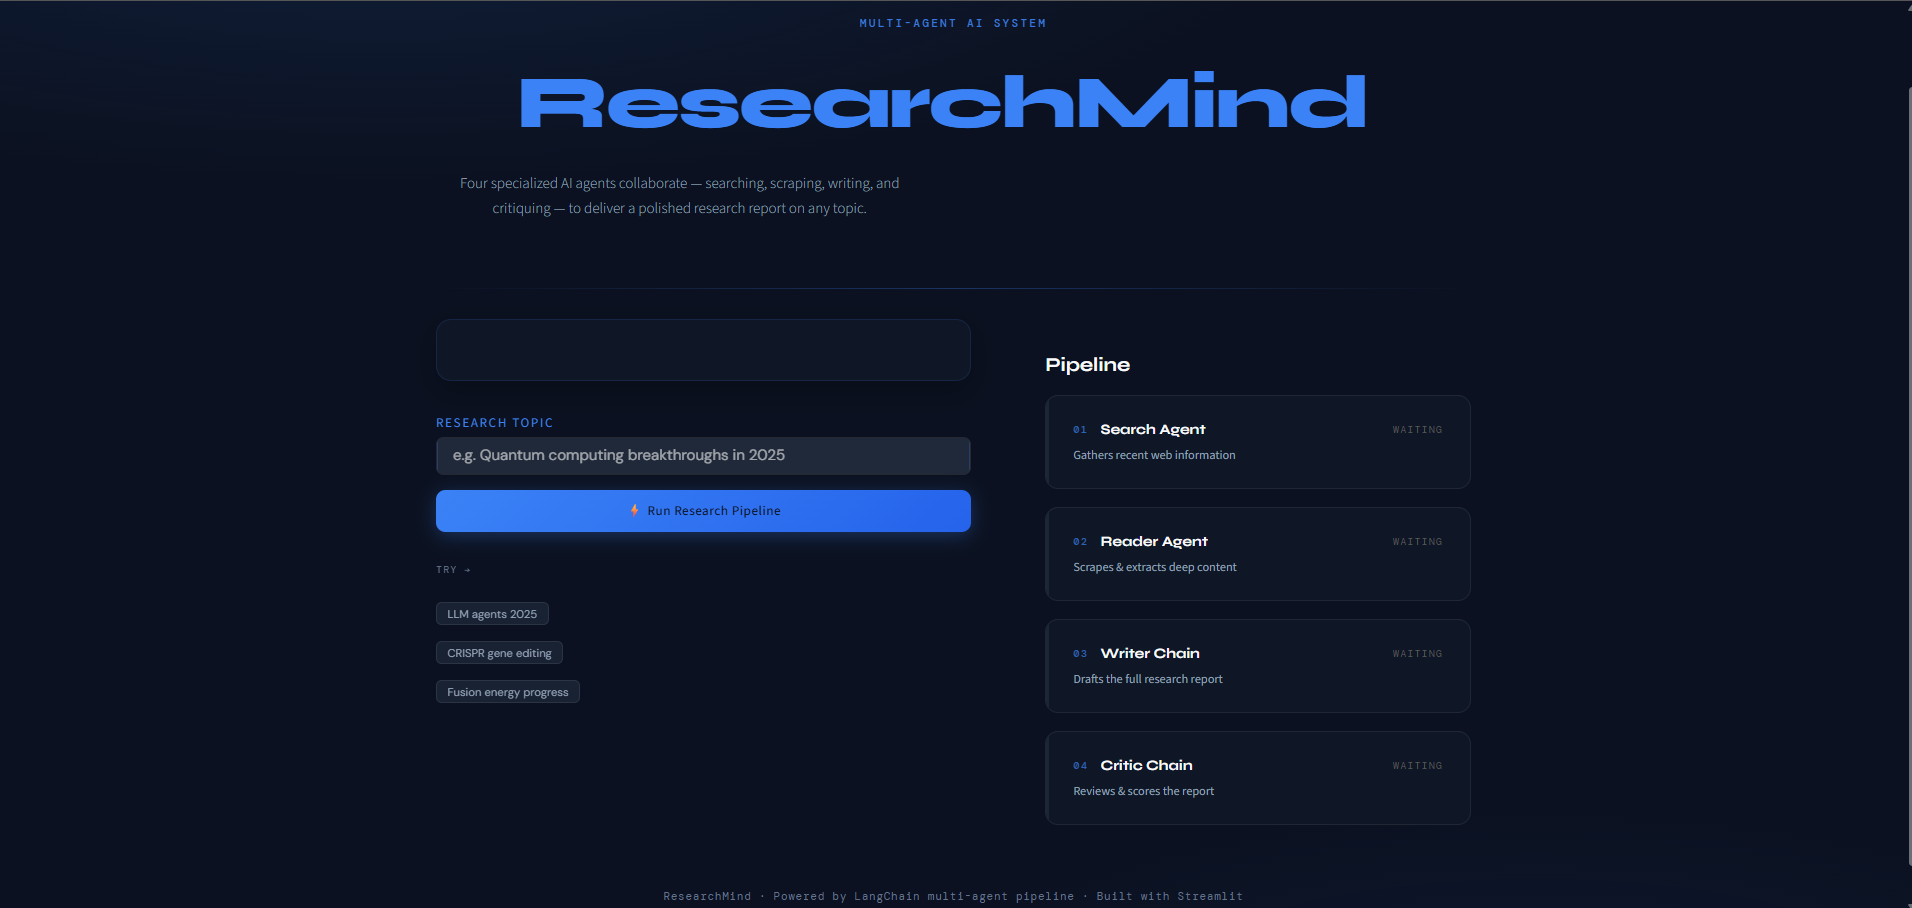
AI Research Agent interface showing a research query, generated citation-backed report, source references, and summarized findings.

AI Research Agent

Finding reliable information across multiple sources is time-consuming and often yields incomplete or conflicting answers. This AI research agent autonomously searches, analyzes, and synthesizes information into a structured, citation-backed report. Unlike a single ChatGPT query, it performs multi-step research with source verification, giving users faster, more transparent, and more trustworthy research results.

  • LangChain
  • Streamlit
  • ChromaDB
  • Google Gemini API
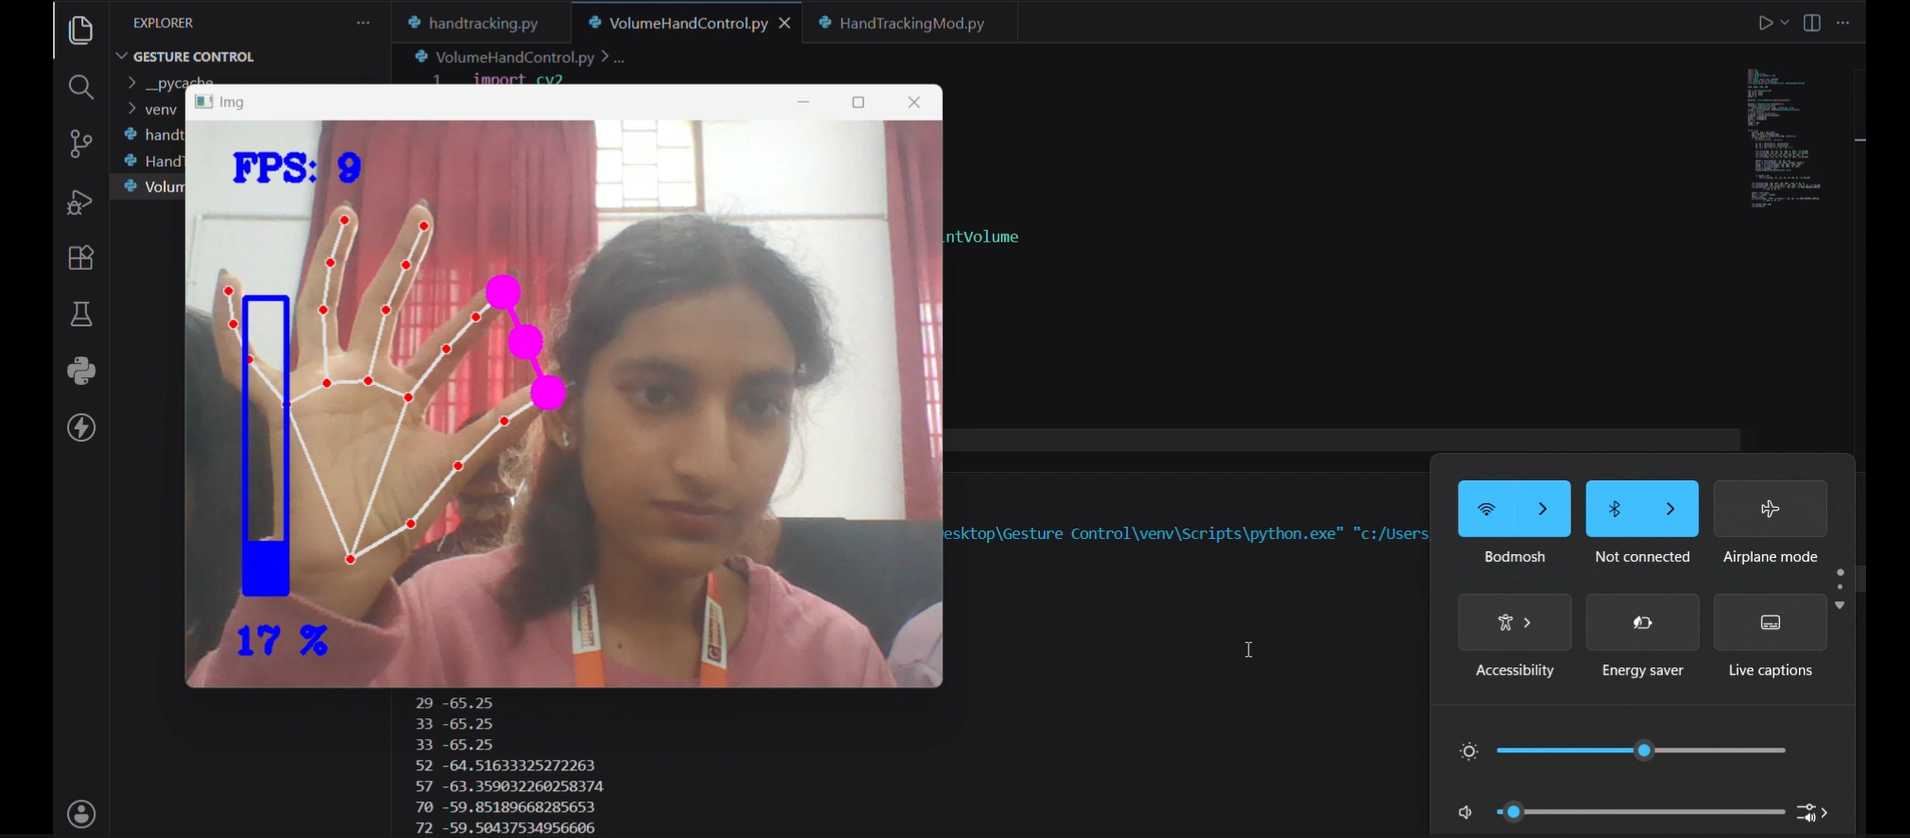
Webcam feed showing hand landmark detection, finger tracking, and a real-time system volume control indicator.

Hand Gesture Volume Control

Traditional computer interaction relies on physical input devices, which can be limiting in hands-free or accessibility-focused scenarios. This project uses OpenCV and MediaPipe to recognize real-time hand gestures and translate them into desktop actions such as cursor movement, clicks, scrolling, and volume control. It demonstrates how computer vision can create a more intuitive and touchless user experience.

  • OpenCV
  • MediaPipe
  • CVZone
  • Pycaw
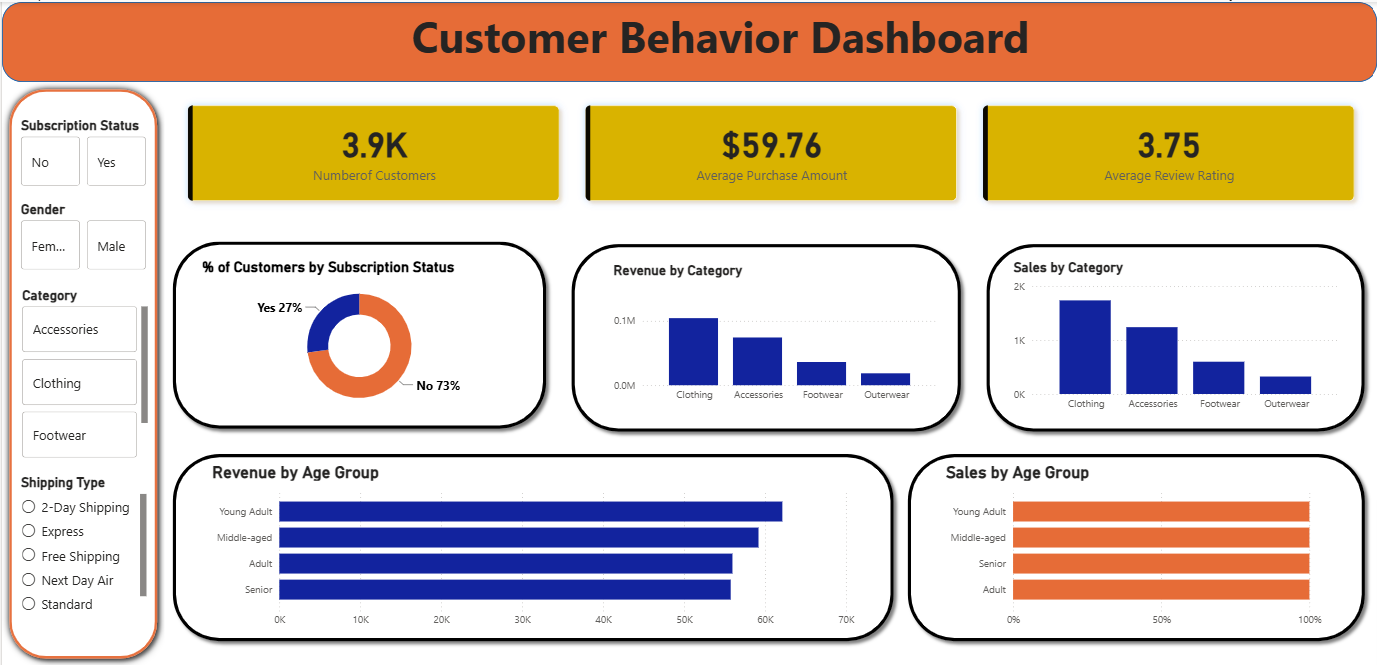
Dashboard showing customer segment pie chart, monthly sales line graph, and KPI summary cards for customer analytics.

Customer Behavior Analytics Dashboard

Businesses often collect large volumes of customer data, but identifying meaningful purchasing patterns and trends from raw datasets can be difficult and time-consuming. This dashboard transforms customer data into interactive visualizations that reveal customer segments, sales trends, and key performance metrics. It helps business owners and marketing teams make informed, data-driven decisions instead of relying on spreadsheets or raw data.

  • Pandas
  • Plotly
  • Power BI
  • Python